STATA 

Academic Research

To date, I have completed a series of research projects focused upon examining the performance of momentum strategies in global commodity futures markets. In order to simulate returns and examine their performance characteristics, I utilised STATA and EViews software suites.  To give you a better understanding of what processes were  required to complete my most recent research project (available here), I have decided to take you through each of the major steps.  

Click here to download a copy of the working paper

Data Collection

The study utilises daily price observations for all available contracts for 26 commodity futures markets between 1959 to 2017 from CRB. Price data is reported by contract in individual spreadsheets in xlsx format and the first major step was to import each contract and compile them into a continuous time series of prices, inclusive of all contracts across the entire futures curve.

Given the vast amount of contracts and data observations, I was required to automate the collection process, through the creation and execution of a DoFile to read; extract; print and merge price observations into one spreadsheet, for each one of the 27 commodities in the sample. 

Click here to download an example of the code which I wrote to complete this task.


Contract Rolling

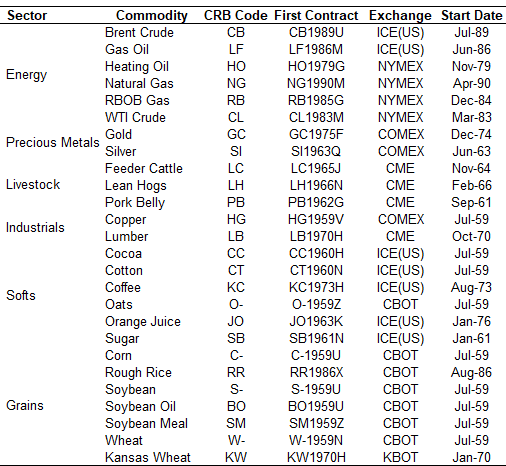
Once the time series of price observations had been compiled, it was then necessary to code a contract rolling methodology, to simulate the price and roll yield effects of holding a continuous exposure to contracts at intervals (namely, nearest and next nearest to expiry) across the futures curve. 

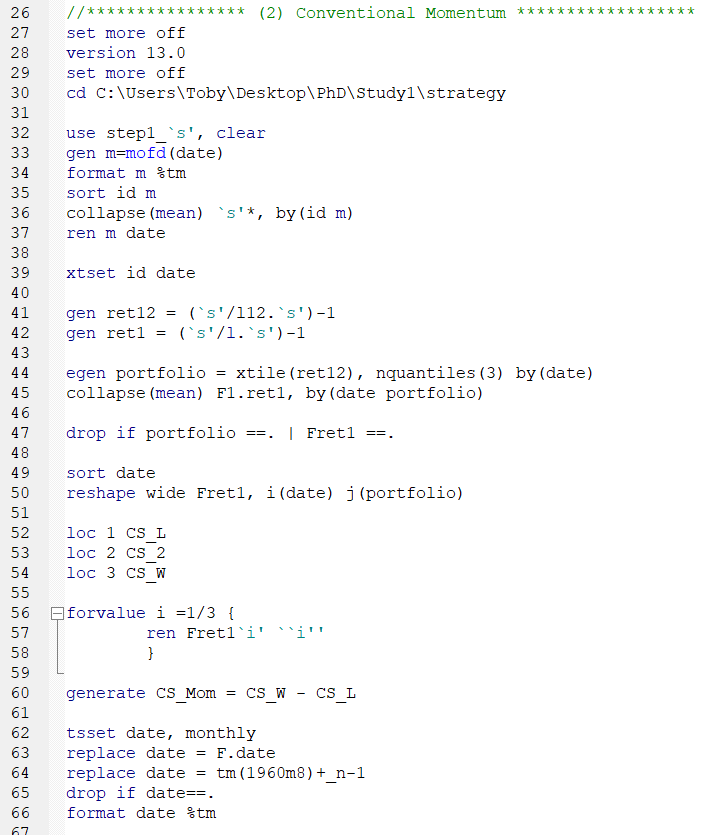
To achieve this, the study utilises methodologies from derived from prior studies in the academic literature. In effect, I constructed a  an executable DoFile to roll price observations over the nearest contract on the last trading day of the last full month prior to expiry.

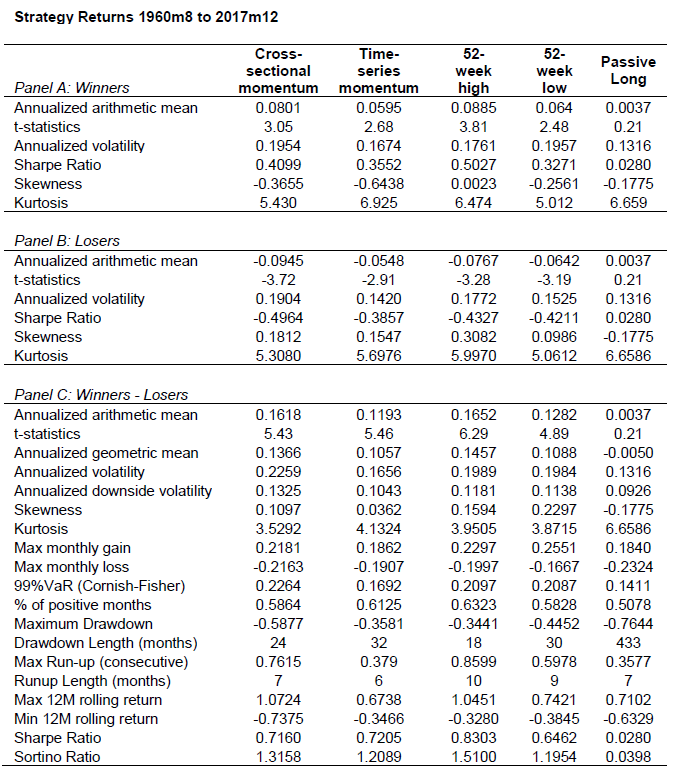
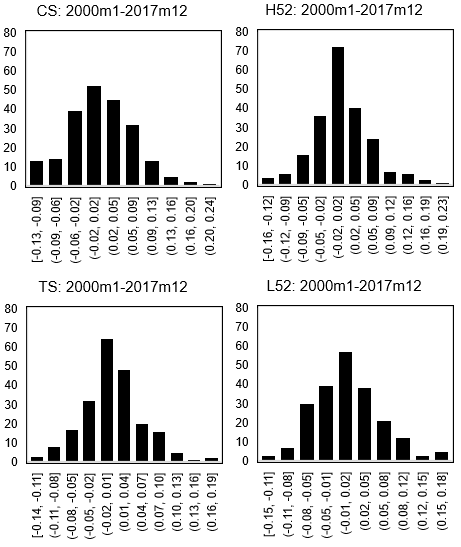
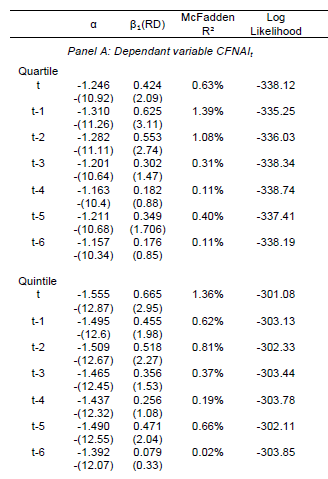
Using these rolled time series outputs, I was able to calculate descriptive statistics for monthly returns for each commodity, which you will see in the image on the left. 

Click here to download an example of the code which I wrote to complete this task.


Signal Generation

To back-test momentum strategy and compare their respective performance, each strategy had to be constructed using the time series of rolled prices derived from the previous step.  

The study examines four momentum strategies (including Conventional Momentum; Time series momentum; 52-week high and 52-week low) and one long-only benchmark portfolio. each one of these strategies utilises sorting signals derived from prior studies from the literature. 

Similar to prior steps, I have constructed STATA code DoFiles to generate Long, Short and Long-Short portfolios of returns throughout the entire sample period.

Click here to download an example of the code which I wrote to complete this task.


Statistical Analysis

Using the back tested strategy returns, I was then able to evaluate statistical performance characteristics in greater detail. Using STATA, I was able to evaluate the risk and return characteristics for each strategy using a series of common statistical metrics. 

I was required to code each statistical evaluation metric and out them in sequence to a csv spreadsheet for evaluation. 

Click here to download an example of the code which I wrote to complete this task.


Visual Aids - Charts and Distributions

The study incorporates a multitude of visual aids to assist interpret and evaluate momentum strategy return characteristics through the sample period.  

Some visual aids include:

  • Cumulative return plots
  • Rolling regression plots
  • Histogram plots
  • Market state and Return dispersion line charts
  • 5 year rolling return plots

Click here to download an example of the code which I wrote to complete this task.


Econometric Analysis

In search of insightful conclusions, the study incorporates a wide array of econometric techniques,including:

  • Ordinary Least Squares regressions, measuring both intertemporal and contemporaneous interaction; 
  • Rolling regression analysis;
  • Stationarity testing (completed using Eviews);
  • Logit regression models; 
  • Welch tests for equality
  • Hetroskedasticity and auto-correlation tests (using Newey-West standard errors);
  • Multicolliniarity tests (measured through the variance inflation factor).

Click here to download an example of the code which I wrote to complete this task.


© Copyright Tobias Forster-Wright