PYTHON

Projects Repository

This web page has been constructed to archive some of my projects which I have completed using python 3 script. I have found python to be an indispensable tool for a wide array of purposes. I have scraped data, created graphical user interfaces, run statistical and econometric analysis, integrated autonomous reporting, measured text sentiment, visualised trends and extracted seasonality, among a plethora of other projects. I utilise my scripting skills everyday, for both personal and professional projects.

Automating Trade Execution with TWS

With the development and backtest of a compelling strategy now complete, we can refocus attention to automating the signal generation and subsequent execution of trading positions through the TWS platform, provided by Interactive Brokers. 

To complete this project, there are a series of subroutines which we need to develop. These include:

  1. Data Collection
  2. Signal Generation
  3. Trade Execution 
  4. Account Feedback to Query Active Positions
  5. Storage of Trade Order Requests

The timing, order and variable input of these five subroutines must be managed by one master routine which can be rerun iteratively (hourly in this case) during market hours, to monitor for trading opportunities with the help of Task Scheduler.

In accordance with the strategy outlined below, the routine will monitor for trading thresholds. In this case, trading will coincide with price crosses above and below upper and lower Bollinger bands (establishing and closing trade orders as required). In the instance that a trade is not triggered (most often the case), the routine will cease after the Signal Generation stage. The routine is scheduled to run each hour in line with market trading hours.

As data collection of trade activity is a vital part of the investment process, I have created a database table in SQL Server to store all trade orders as they are sent to the broker.

The routine has been setup to run on a small form factor Raspberry Pi 4 server using a Linux operating system. The benefit of doing so enables quiet, low powered operation that can run at any time of the day or night, enabling autonomous trading in markets with relatively awkward time zone differences.

SMAs & BBs: A Retail Investor's Quant Strategy

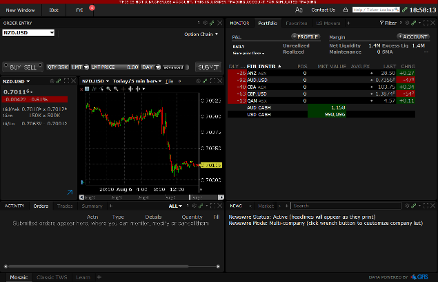
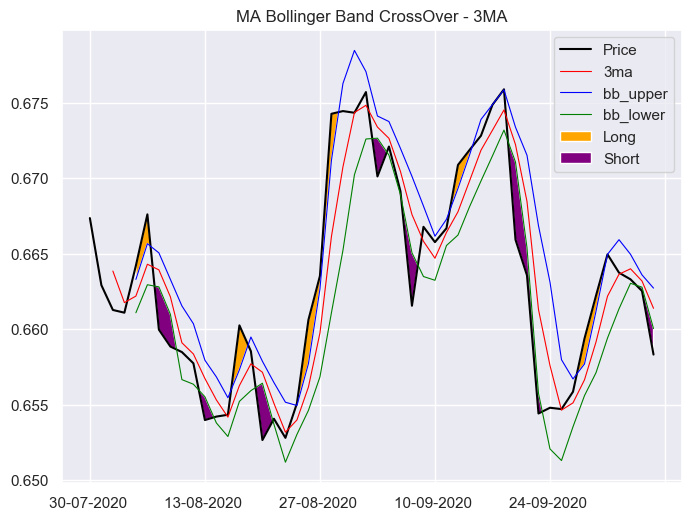
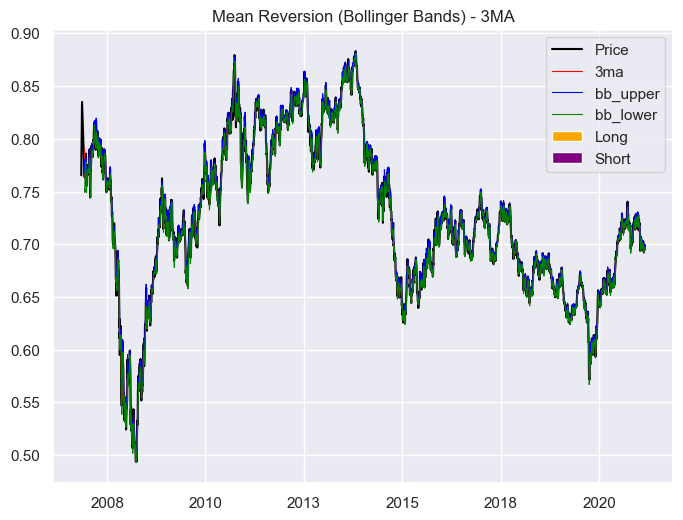
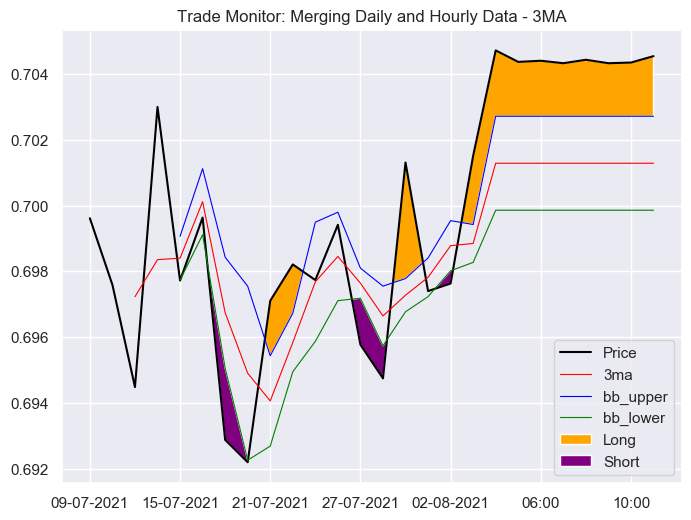
Using the API provided by Interactive Brokers, I was interested to construct and backtest a simple trend based strategy. Moving average indictors have a long history of application among technical analysts and can be useful for identfying price trends, breakouts and reversions. Motivated by the simplicity of this indicator, I downloaded daily OHLC observations for FOREX NZD/USD (chosen at random for the sake of development) trading pairs from July 2007 to July  2021. Using the Closing price series, I overlayed Arithmetic Simple Moving Average lines (rolling period average, MA hereafter) and Upper and Lower Bollinger Bands (BB hereafter) of the MA. Refer to the following notation, where sigma denotes standard deviation and x bar denotes arithmetic mean. Upper BB = (MA + 2 * sigma); MA = (rolling 3 period x bar); Lower BB = (MA - 2 * sigma)     

Using these indicators I constructed trading signal rules: Long (Depicted in Orange) when the price crosses above the Upper BB (Blue Line), and Short (Depicted in Purple) when the price crosses below the Lower BB (Green Line). Intuitively, the strategy should be able to capture returns from persisting upward and downward trends in the price series, whilst remaining neutral during periods of sideward ranging price movement (i.e. within the bounds of Upper and Lower BBs). 

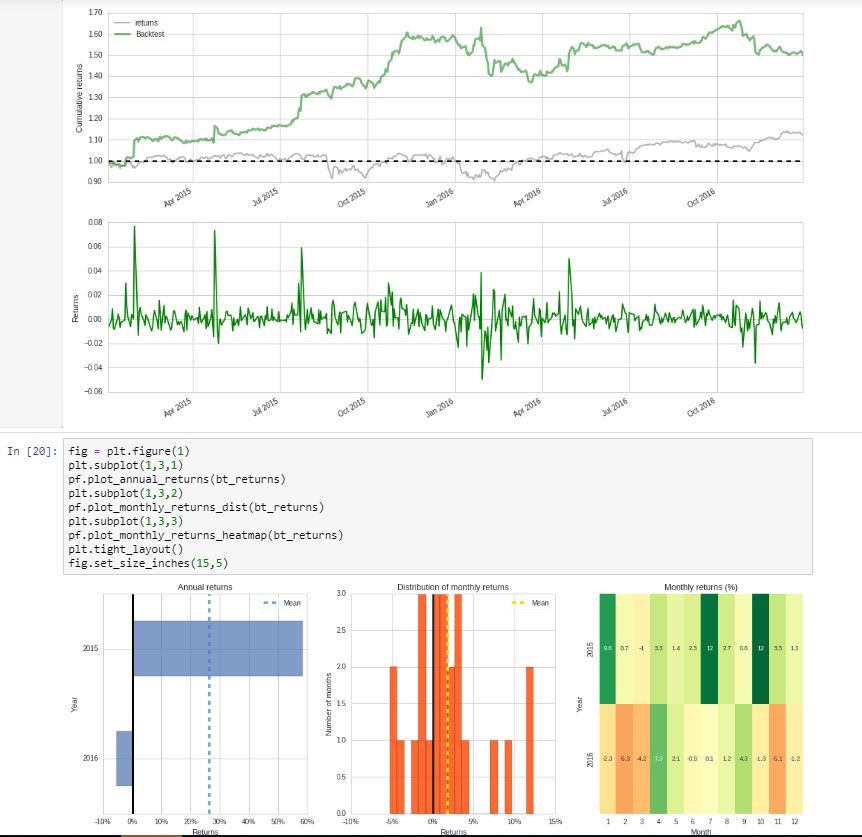
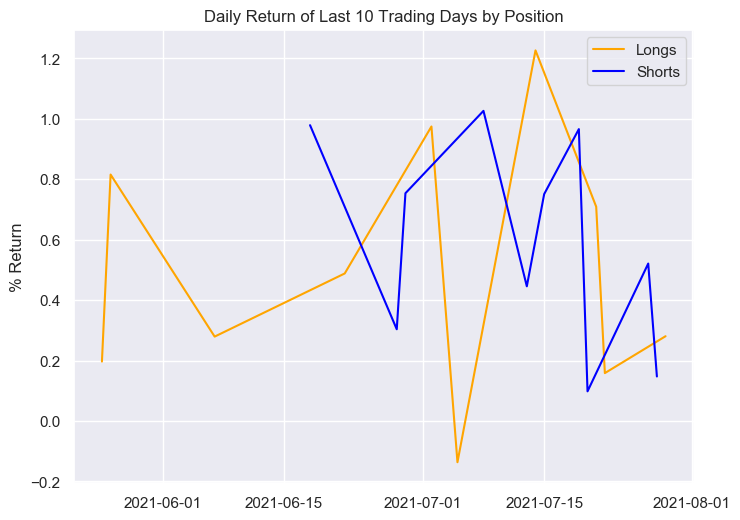
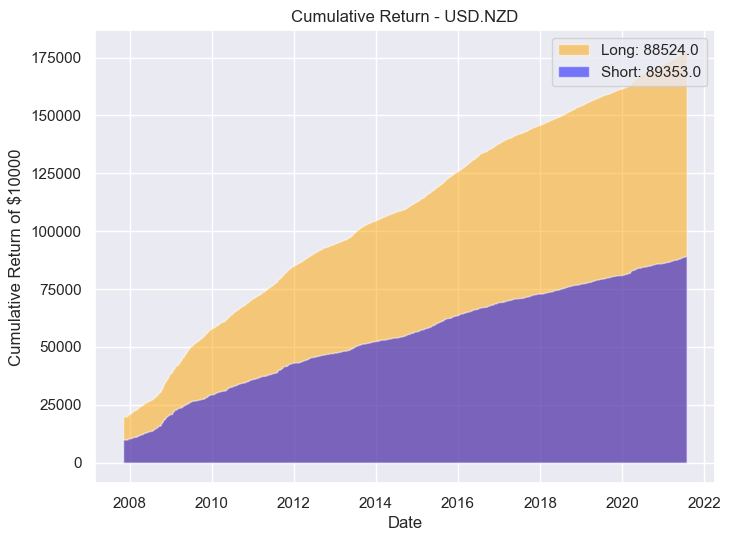
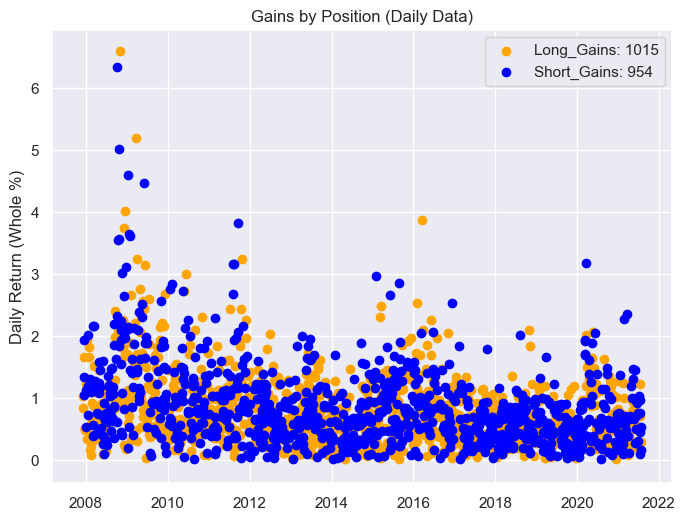
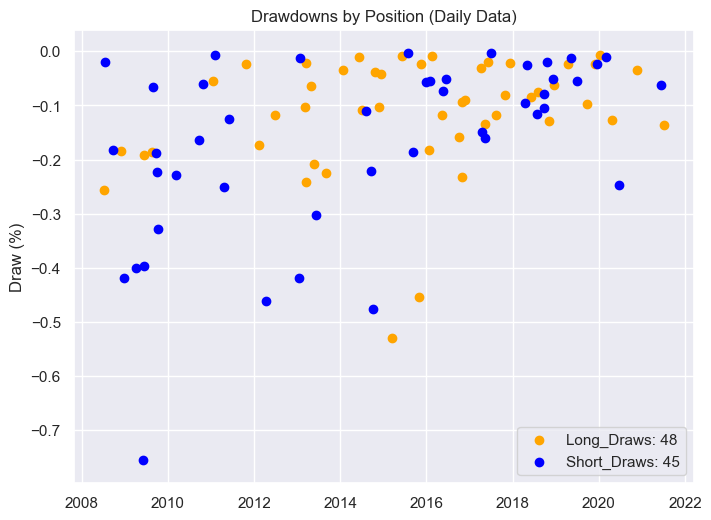
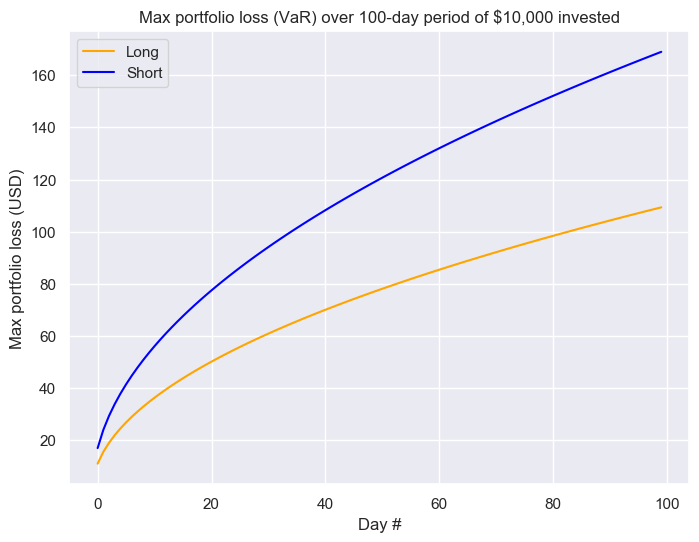
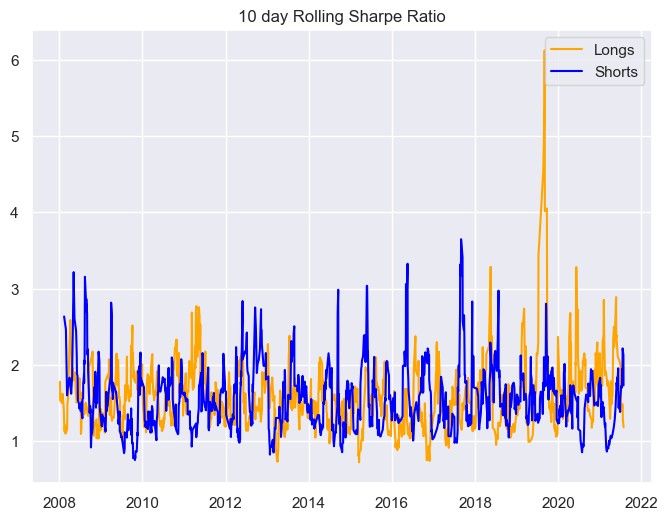
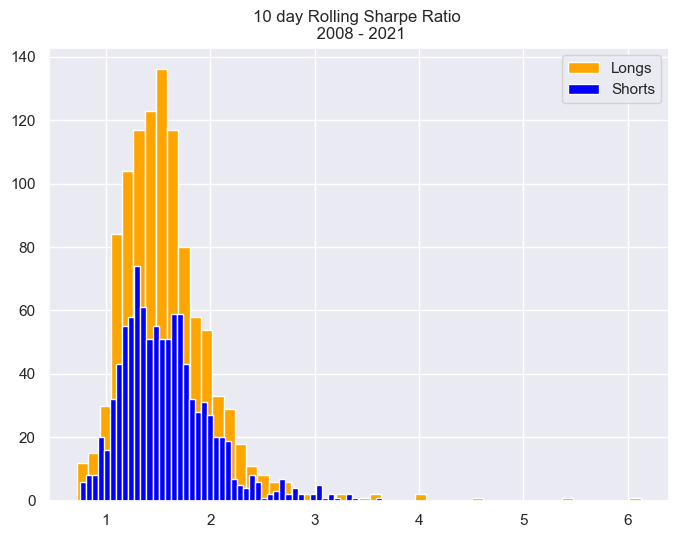
From here, we can collect and analyse the persistence, volatility and risk adjusted return components generated by each position through time.  From the statical summary, we note strong significant daily returns approximating 0.8%, Sharpe exceeding 1.15, Sortino at a stagering 6.9 and 4.8 respectively, and a 99% VaR at -0.11 and -0.17. Reviewing the cumulative returns and rolling Sharpe plots, we note a strong persistency in positive returns with negligable drawdown periods (almost a perfectly straight slope in the cumulative series). Investigating further, we examine the drawdowns and extrapolate the VaR metric to measure the potential tail risk over a 100 day investment period and confirm negligable impact from drawdowns, approximating ~0.12% daily over the 49 draws and ~0.17% over 45 draws, respectively. 

But could it all be too good to be true? Like many skeptics out there, when presented with results that appear 'too good to be true', my mind wonders what went wrong? What are the real risks to a strategy like this? What are the drivers and dependents for performance? Interestingly, if we examine the distribution of Holding Periods for trades in each position, we note that ~48% of all trades last only 1 day and the longest trades approximate only 4 days. This relatively high frequency suggests high transaction costs and a considerable risk of slippage at the execution end, which are not effectively captured by the analytics from this project.

The next logical step to examine effectiveness of this strategy, would be found in the PnL review from deployment to a paper trade account, which is currently in development. 

Sentiment Analysis

I have completed a number of projects focused on measuring the sentiment of language used in text. I was interested to examine the relationship between the US Fed Cash Rate and the sentiment embedded within the minutes, press release statements & economic projections from the FOMC.

The crical question motivating this project is whether or not language sentiment (that is to say, the choice of words used) within FOMC documents are visually correlated with the US Cash Rate over time. As part of this project I downloaded all meetings and historical cash rates  in script and construct a time-series of rate meeting sentiment valence using the Vader package.

The plot presents the cash rate change (Red) and the change in Negative Sentiment (Blue).

In order of appearance, the figures depect FOMC Economic Projections negative sentiment; FOMC Press Release Statement negative sentiment; and FOMC Meeting Minutes negative sentiment vs. Cash Rate, respectively. 

Beyond simple visualisation, this project could be extended to measure each relationship through regression analysis, as well as quantify trend and seasonal effects present in the data. 

Click here to download a copy of the script.

Autonomous Reporting 

Python has great functionality to scrape table data from the internet. I have had great success automating the extraction and delivery ofearning surprise data through yahoo finance. I currently maintain a routine to construct custom earnings surprise reports, which is now totally autonomous in execution and delivery.

System BIOS will boot my PC at a specified time each day, login and execute a series of scripts to gather EPS surprise and a host of other fundamental and technical data, format the data in a prescribed format, save in excel format, and email the reports to me. On completion, the PC will be shutdown. 

The result provides me with daily custom earnings reports, accessible through the email inbox in my mobile phone, which I can peruse while I commute home from work.

This example illustrates some of the potential inherent within scripting languages.

Graphical User Interface Development

To date, I have completed numerous end-to-end automation projects with GUI interfaces. The vast majority of these projects have been primarily to automate manual work processes . The power of GUI implementation enables scripted routines to be utilised by non-technical users, without knowledge of python scripting. 

The depicted example is a webscraping GUI application developed to evaluate job listings data from from the web. The function of this project is to provide a means to systematically evaluate trending experience, remuneration and key skill requirements embedded in job listings with the help of regex package (regular expression) in python.

The essence of this GUI demonstrates the potential for implementation of bespoke applications . The end result is a user friendly interface which can be readily utilised by non-technical users. 

Click here to download a copy of my script used to create this GUI. 

API - Client & Hosting 

Google search trends; Interactive Brokers; Alpha Vantage (live financial data);

I have employed APIs to extract live pricing data in a python environment. The benefit of which enables the automation of trade signal monitoring outside of a broker environment.  I have also had success in automating the execution of simple trades through Interactive Brokers API. The benefit of which enables systematic monitoring and execution of trades without human intervention.

I have employed google APIs to source financial reports (PDF) of all listed securities and systematically archived them for future projects. 

The image on the right depicts minute data provided by Alpha Vantage API for the top 5 'most active' stocks scraped from yahoo finance: https://finance.yahoo.com/most-active

Click here to download a copy of my script use to create this data feed.

More recently, I have experimented with API hosting with Flask in Python. Follow the link to download. This example hosts Fama & French Asset Pricing Factor data, which is called and evaluated in a second script. 

Quantopian

Sadly no longer available, Quantopian provided an indispensable platform to construct and back test systematic investment strategies. Quantopian offered a free web-based coding platform, open to anyone to simulate returns of systematic investment strategy for an array of liquid financial assets. 

The website provided a fantastic place to test ideas and develop quantitative analytical skills using python. I have found it to be a highly useful source of knowledge for systematic strategy development. 

I would encourage anyone with an interest to take a look - https://www.quantopian.com/

ARIMA Modelling

My former role as a forecast analyst provided ample opportunity to apply a quantitative approach toward evaluating the demand planning habits of clients. I have utilised ARIMA (Auto-Regressive Integrated Moving Average) models over historical data to gain greater insight into dynamics of performance at client, sector and aggregate levels.

I am constantly looking for opportunities to apply advanced tools and techniques to improve the effectiveness of my capacity as an analyst and a professional.

As the aforementioned project pertains to work specific data, I am not at liberty to share the result.

MySQL + Ubuntu (Linux)

I have experimented with archiving historical data in MySQL. 

Incorporating python script, MySQL and the alpha vantage API, I have collected and stored daily OHLC and VOL data for all 505 constituents of the SP500, over the largest available sample period (stretching back to 05/2000). 

Critically, I have built this routine in a more stable Linux environment (Ubuntu). The benefit of which provides contextual experience for future projects. 

With price data now stored locally, I can back test and apply quantitative trading strategies upon historical data, in a paper based environment, without dependency upon an API to provide a data feed.

© Copyright Tobias Forster-Wright